tools: add cephtrace_report.py - a visual summary of trace output#140
Open
taodd wants to merge 2 commits into
Open
tools: add cephtrace_report.py - a visual summary of trace output#140taodd wants to merge 2 commits into
taodd wants to merge 2 commits into
Conversation
radostrace and osdtrace stream one line per IO - thousands of rows. The
existing analyzers turn that into numeric tables but draw nothing, and
require knowing which flags to run. cephtrace_report is the zero-flag
visual glance: it auto-detects the tool and prints bar charts plus a
log-scale latency histogram so a capture's shape is understandable at
sight.

For osdtrace the headline is a 'where the time goes' block - the share
of total latency per stage (messenger/queue/osd/bluestore, with
kv_commit broken out) - which turns the dense per-stage numbers into an
instant 'it's RocksDB commit, not the network'. radostrace gets a
read/write split, per-pool bars, and a slowest-acting-set culprit hint.

It deliberately does NOT add a second parser: the osdtrace path reuses
analyze_osdtrace_output.parse_line and the radostrace path reuses
analyze_radostrace_output.detect_file_format and the same column layout,
so it can't drift from the analyzers. It complements them (and links to
them for the deep-dive numbers) rather than replacing them. Reads a file
or stdin, and both the space format and the CSV that 'radostrace -o'
writes.

Pure stdlib; flake8-clean and pylint 10/10 (the snake_case filename is
required for both the linter and the pytest import). Adds a committed
small osdtrace sample and offline pytest smoke tests that run via the
existing tox -e test in CI. Docs: a new visualizing-output.md plus
pointers from the two analyzer docs and the README.
Adds a browser-viewable companion to the terminal summary. cephtrace_report.py
--html <file> writes a single self-contained .html (no CDN, no server, works
offline - attach it to a ticket) with everything the terminal view shows plus:

- latency over the capture (p95 per slice, arrival order) - reveals workloads
  that degrade or run in bursts, which a terminal can't show
- hover tooltips on every bar; sortable per-OSD/per-pool and slowest-ops
  tables; click a group row to filter the histogram to that OSD or pool

The HTML/CSS/JS lives in a separate report_template.html (so the Python stays
flake8/pylint clean - long JS lines in an embedded string would trip E501).
Python precomputes compact aggregates (overall + per-group histograms,
per-slice percentiles, group stats, top-50 slowest) and inlines them as JSON;
all rendering is vanilla JS over that payload, so a ~116k-op capture is a ~20KB
file. The osdtrace path reuses parse_line and the radostrace path the shared
column layout - still no second parser. '<' in the payload is escaped so an
object name can't break out of the <script>.

Refactor: histogram bucketing factored into _bucketize/_HIST_* shared by the
terminal and HTML paths; parsing factored into _load. Terminal output is
unchanged.

pytest covers HTML generation for both tools (payload parses, self-contained,
per-group histograms present, --html requires a filename); flake8-clean,
pylint 10/10. Docs updated with rendered screenshots.
Owner
Author
Added:
|
This file contains hidden or bidirectional Unicode text that may be interpreted or compiled differently than what appears below. To review, open the file in an editor that reveals hidden Unicode characters.
Learn more about bidirectional Unicode characters
Sign up for free
to join this conversation on GitHub.
Already have an account?
Sign in to comment
1 participant
Add this suggestion to a batch that can be applied as a single commit.This suggestion is invalid because no changes were made to the code.Suggestions cannot be applied while the pull request is closed.Suggestions cannot be applied while viewing a subset of changes.Only one suggestion per line can be applied in a batch.Add this suggestion to a batch that can be applied as a single commit.Applying suggestions on deleted lines is not supported.You must change the existing code in this line in order to create a valid suggestion.Outdated suggestions cannot be applied.This suggestion has been applied or marked resolved.Suggestions cannot be applied from pending reviews.Suggestions cannot be applied on multi-line comments.Suggestions cannot be applied while the pull request is queued to merge.Suggestion cannot be applied right now. Please check back later.
Summary
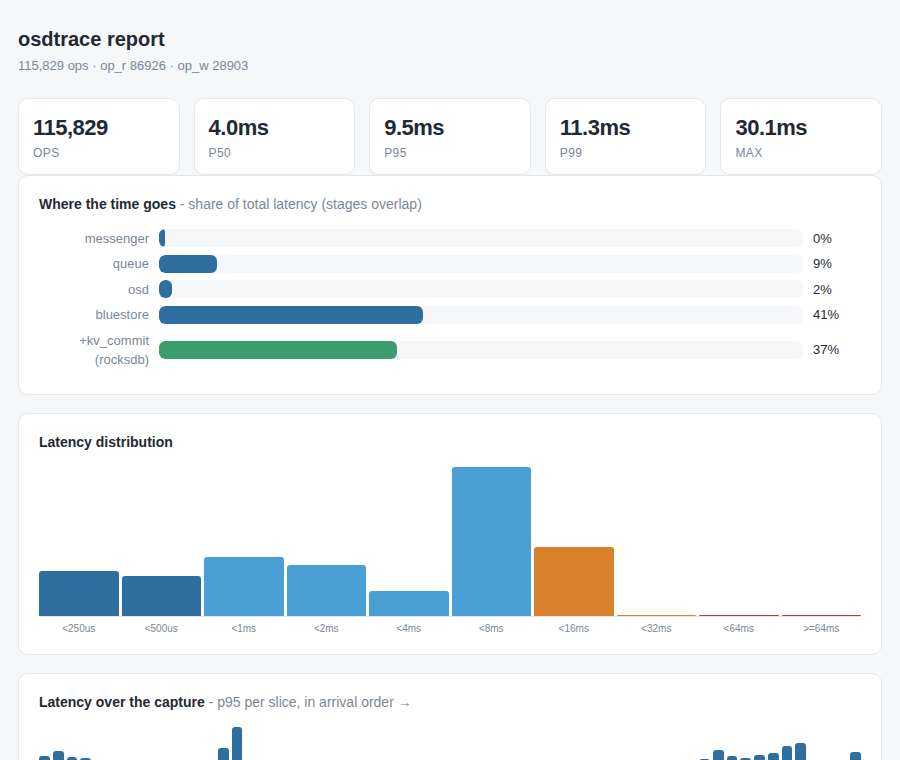
radostraceandosdtracestream one line per IO - thousands of rows per capture. The existing analyzers turn that into numeric tables but draw nothing, and you have to know which flags to run.tools/cephtrace_report.pyis the zero-flag visual glance: point it at a log (or pipe one in), it auto-detects the tool, and prints bar charts + a log-scale latency histogram so a capture's shape is understandable at sight.osdtrace (real output, ~116k ops)
The where the time goes block turns osdtrace's dense per-stage numbers into an instant "it's RocksDB commit, not the network or queue." A per-OSD p95 block appears when >1 OSD is captured, surfacing an outlier directly.
radostrace (real output)
Plus per-pool bars and a slowest-acting-set culprit hint.
Design: reuse, don't duplicate
It deliberately does not add a second parser. After reading both existing analyzers end-to-end, this:
analyze_osdtrace_output.parse_line(handles op_r/op_w/subop_r/subop_w, optional peers, optional bluestore details)analyze_radostrace_output.detect_file_formatand the same column layoutso it can't drift from them. It complements them - it's the visual glance; the analyzers remain for the deep-dive numbers (percentile tables,
-istage contribution, iterative host-mapped culprit ranking), and the report links to each.Quality / CI
tools/.)--help, and run-as-script. These run automatically via the existingtox -e testin the "Run Tests" workflow.Docs
New
doc/visualizing-output.md(with real example output), plus pointers fromanalyze-osdtrace.md,analyze-radostrace.md, and the README.Verified
Run against real captures from the test VMs (single-OSD squid, 3-OSD tentacle, both space and
-oCSV formats); all op types and both formats parse and render correctly.