The function mark_sig() does not directly support multigroup models when using the fit object from lavaan. However, I have developed a workaround: we can use the parameter table, as suggested in the mark_sig() function.
Here’s a reproducible example:
library(lavaan)
#> This is lavaan 0.6-19
#> lavaan is FREE software! Please report any bugs.
library(semptools)
library(semPlot)
# Define a CFA model
model <- "visual =~ x1 + x2 + x3
textual =~ x4 + x5 + x6
speed =~ x7 + x8 + x9"
# Fit the model with multigroup data
fit <- cfa(model = model, data = HolzingerSwineford1939, group = "school")
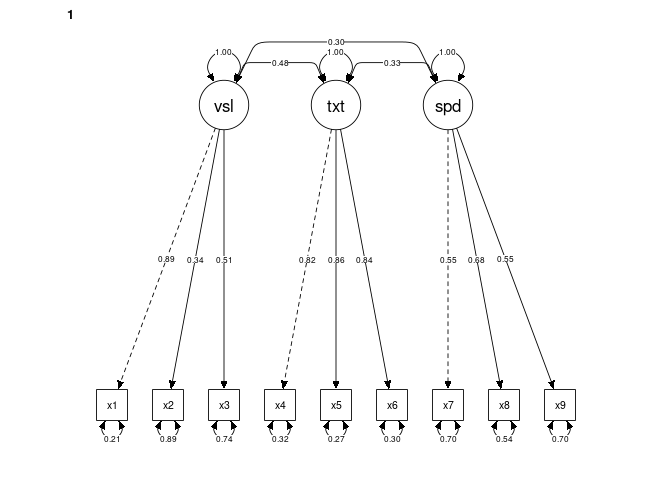
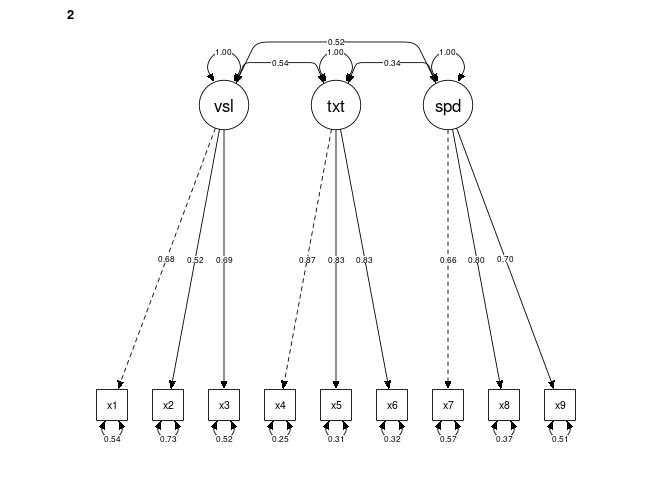
# Generate initial SEM plots
plots <- semPaths(object = fit,
thresholds = FALSE,
whatLabels = "std",
intercepts = FALSE,
exoCov = TRUE,
style = "ram",
curvePivot = TRUE,
edge.color = "black",
DoNotPlot = FALSE) # TRUE produces an error (reported on semPlot's GitHub)Initial plots for multigroup models:
First Approach: Using mark_sig() Directly
Attempting to use mark_sig() directly results in an error:
#### first approach ####
#error produced
plot_g1 <- mark_sig(plots[[1]], fit) #individual approach; plot by plot
#> Error in `mark_sig()`:
#> ! Multiple-group models are not currently supported.
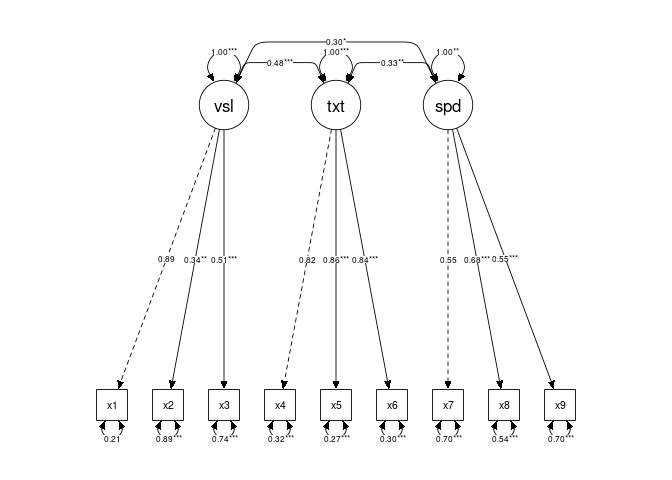
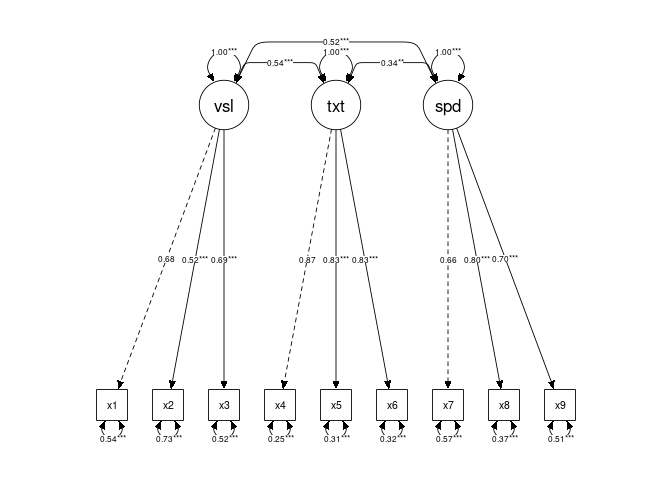
Second Approach: Workaround with Parameter Estimates
To bypass the limitation, we extract parameter estimates for each group and apply mark_sig() manually:
#### second approach ####
#extracting parameter estimates
par_ests <- parameterEstimates(fit)

n_groups <- length(names(inspect(object = fit)))

# Loop over each group
for (g in 1:n_groups) {
  # Extracting parameter estimates
  par_ests <- parameterEstimates(fit)

  # Selecting the ones required for the current group
  par_ests_group <- par_ests[par_ests$group == g, c("lhs", "op", "rhs", "pvalue")]

  # Mark significance and store the plot
  plots[[g]] <- mark_sig(semPaths_plot = plots[[g]], ests = par_ests_group)
}

for (i in 1:length(plots)) {
  plot(plots[[i]])
}
Updated plots with marked significance for each group:
Created on 2024-12-16 with reprex v2.1.1
The function
mark_sig()does not directly support multigroup models when using thefitobject fromlavaan. However, I have developed a workaround: we can use the parameter table, as suggested in themark_sig()function.Here’s a reproducible example:
Initial plots for multigroup models:
First Approach: Using
mark_sig()DirectlyAttempting to use
mark_sig()directly results in an error:Second Approach: Workaround with Parameter Estimates
To bypass the limitation, we extract parameter estimates for each group and apply
mark_sig()manually:Updated plots with marked significance for each group:
Created on 2024-12-16 with reprex v2.1.1