Features implemented up to interim interview (week 11, 16/12/2020).
As of week 11, the program allows:
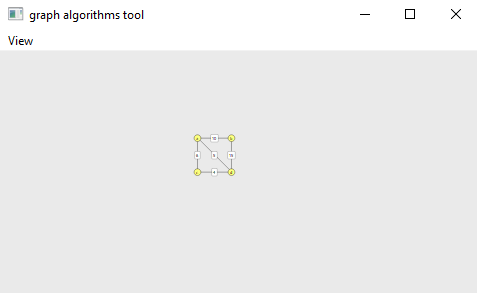
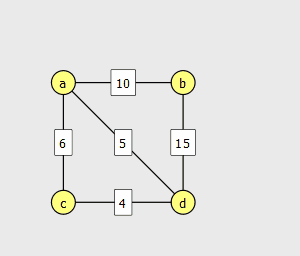
- creating and modifying a graph
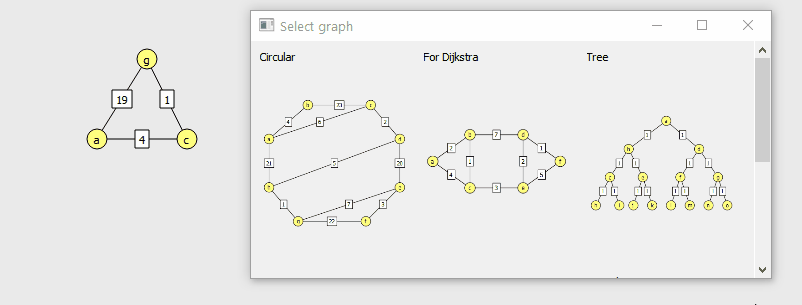
- using preset graphs (designed to help with understanding of algorithms working principle)
- storing, restoring and deleting custom built graphs
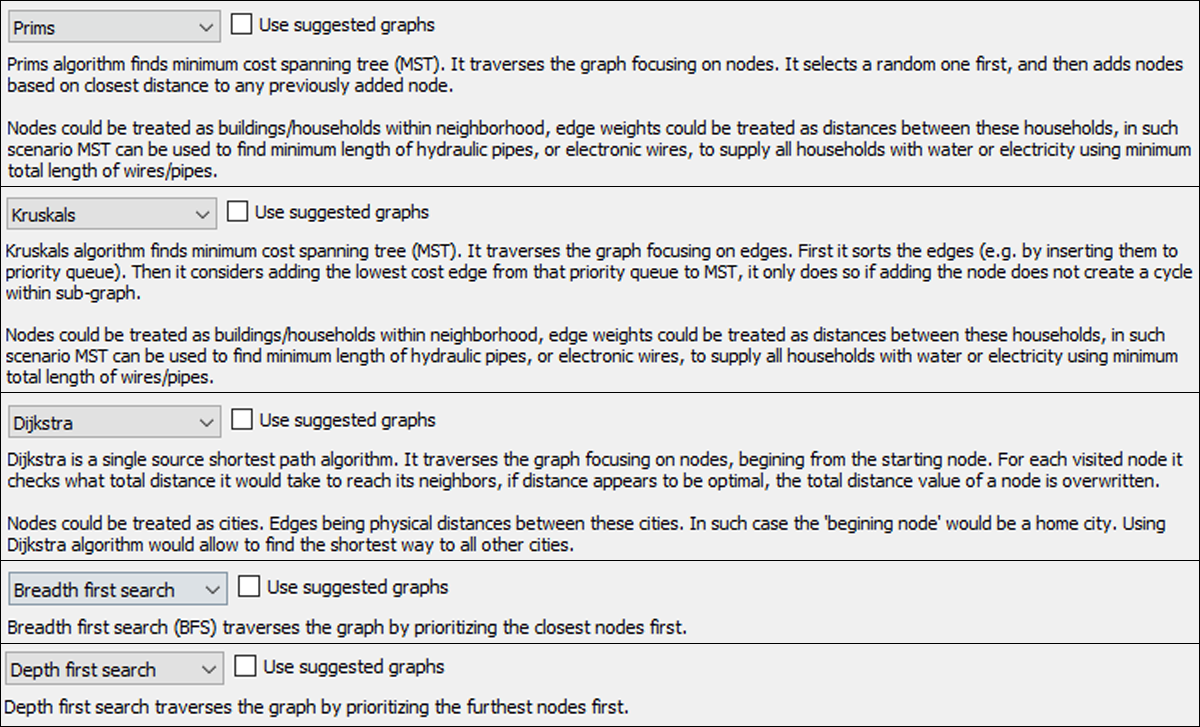
- running all 5 algorithms taught in CE204 module, such as:
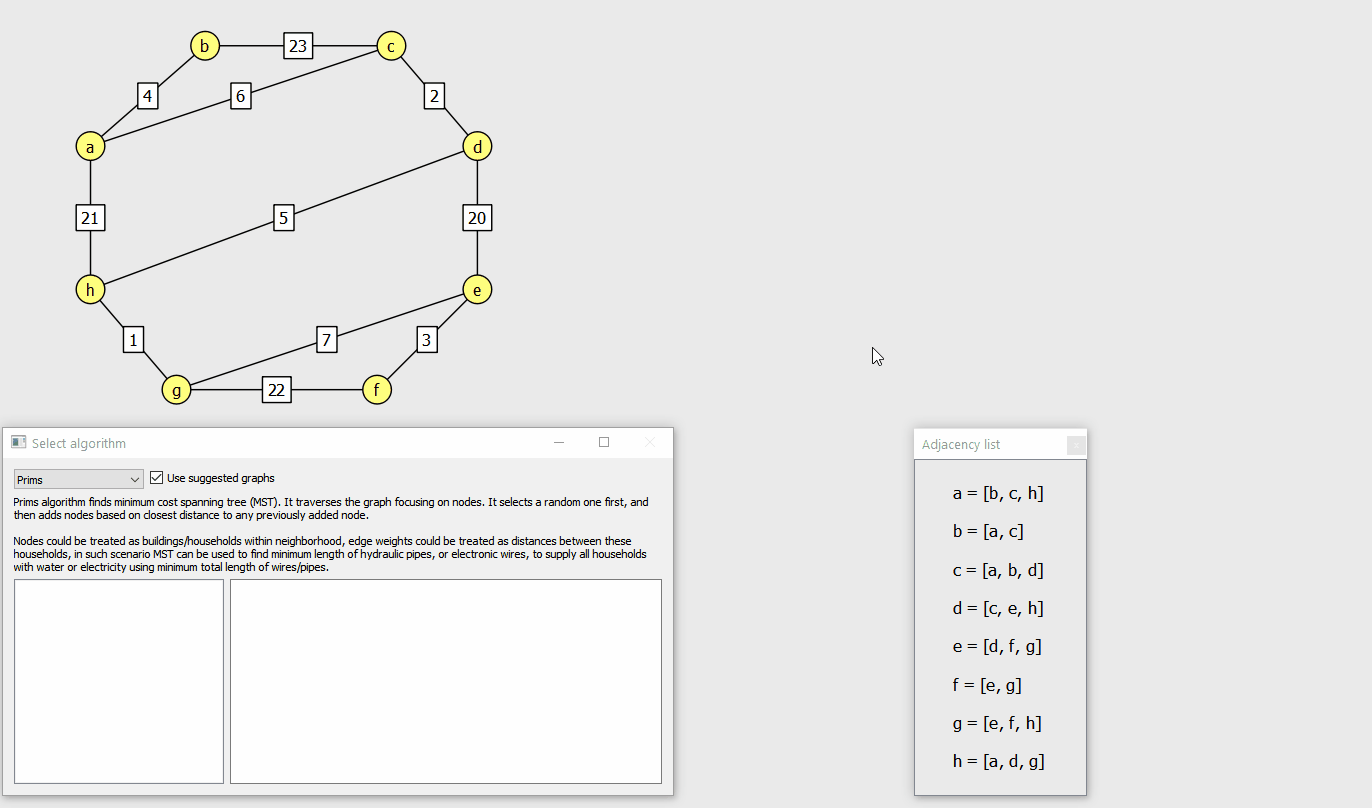
- Prim's
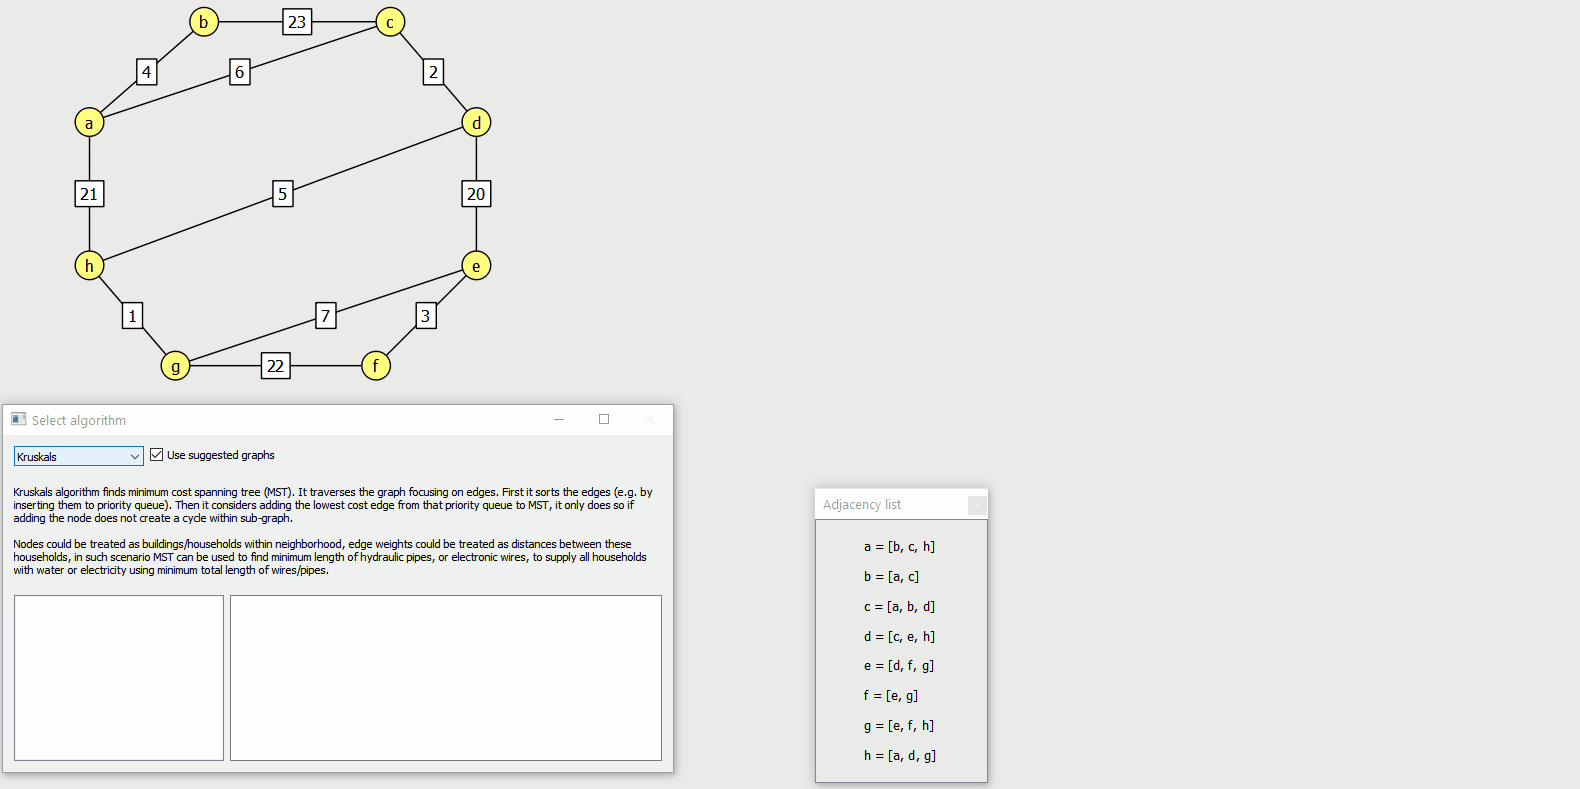
- Kruskal's
- Dijkstra
- Breadth first search
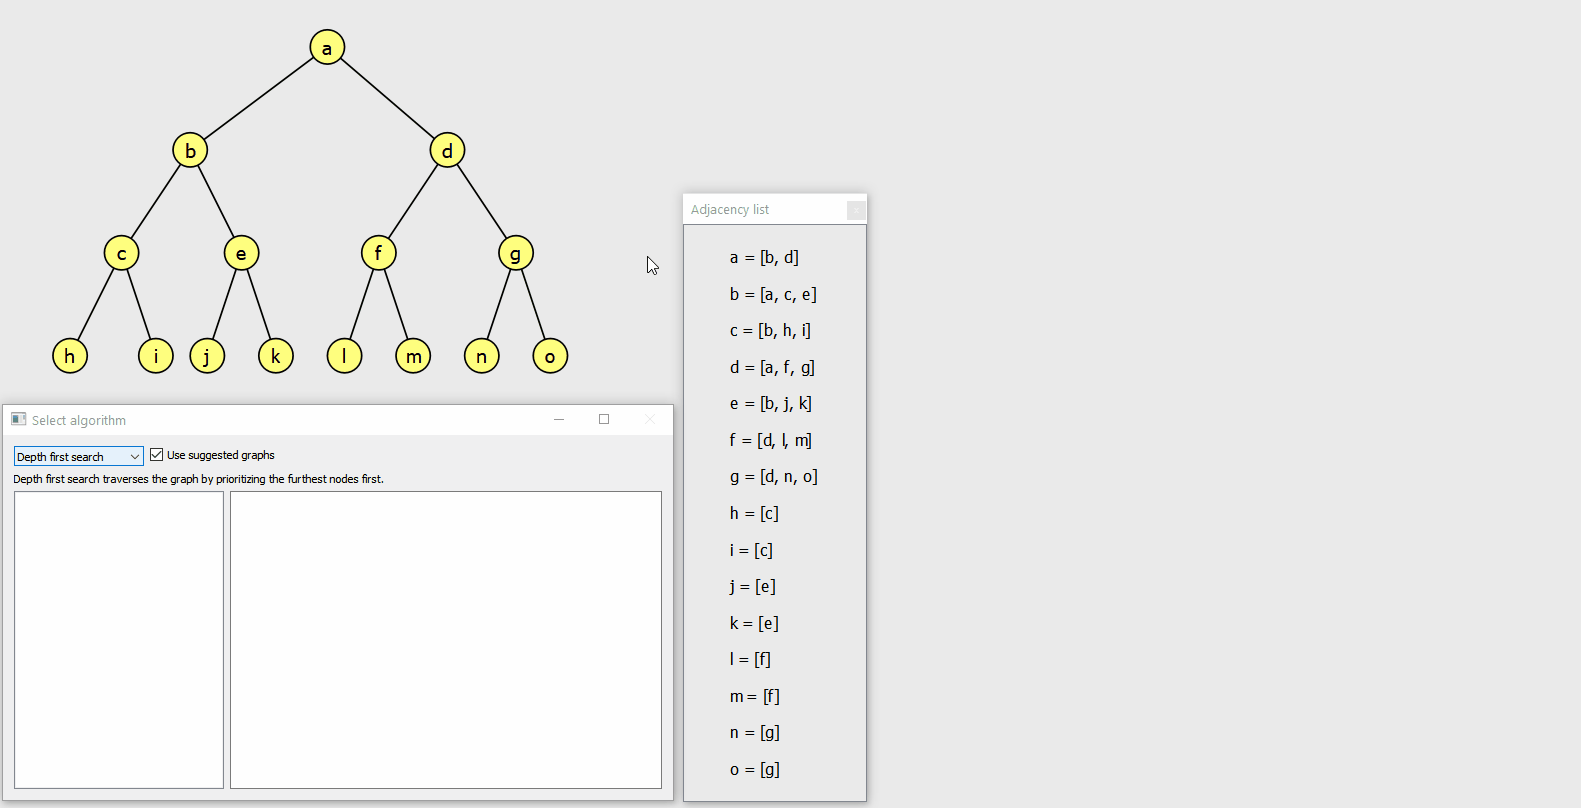
- Depth first search
The user can select an algorithm, progress through it single step at a time and observe various data, of which demonstration can be found in the Algorithms features section. Multiple features were implemented for convenient usage of the program, these are documented in the User interface features section below.
As I mentioned in the background reading description. The built-in way of moving structured QGraphicsItem objects (with at least 1 level of parent-child relation), is not working well by default.
I created "MovableGraphicsItem" class which implements behaviour needed to correctly move a parent item and all the child items. Within mousePressEvent it recognizes the start of movement:
// movable_graphics_item.cpp file

void MovableGraphicsItem::mousePressEvent(QGraphicsSceneMouseEvent *event) {
    is_moved = true;
    grabbed_offset = event->scenePos() - scenePos();
}
Within mouseMoveEvent it performs the movement (assuming it was started). It can be noticed that movement has certain granularity which allows to easily align the item to aestheticaly position it among other items. In case if the user wanted a fine control over position there's a possibility to press control key while moving the item (which will put it directly under the mouse).
// movable_graphics_item.cpp file

void MovableGraphicsItem::mouseMoveEvent(QGraphicsSceneMouseEvent *event) {
    const int granularity = 10;

    if (is_moved) {
        QPointF new_pos = event->scenePos() - grabbed_offset;
        if (QGraphicsItem *parent_item = parentItem())
            new_pos -= parent_item->scenePos();

		// use "GetClosestPoint" only if control key is not pressed
        if (~event->modifiers() & Qt::ControlModifier)
            new_pos = GetClosestPoint(new_pos, granularity);

        if (pos() != new_pos) {
            setPos(new_pos);
            if (QGraphicsScene * scene = this->scene())
                scene->update();
        }
    }
    else {
        QGraphicsItem::mouseMoveEvent(event);
    }
}
Within mouseReleaseEvent it recognizes that the movement is finished:
// movable_graphics_item.cpp file

void MovableGraphicsItem::mouseReleaseEvent(QGraphicsSceneMouseEvent *event) {
    is_moved = false;
	...
Currently, several classes inherit from MovableGraphicsItem class, for example:
- Graph
- Node
- PrimsLegendItem
- VtableGraphicsItem
- CodeGraphicsItem
Initially I created an interface within a single window and quickly realized that the more types of graphical items I create, the more I worry about utilizing space. One way of dealing with it was to create multi-window interface using QDockWidget class which allows:
- resizing/scaling objects to suit user preferences
- moving window to separate monitor independently of other windows
- opening and closing
- docking sub-window within the side of the main window (however it is not really needed in this program and could be disabled)
It's possible to zoom-in and zoom-out of the graph by using mouse wheel. Using mouse cursor position as an anchor makes user experience more comfortable.
It could be possible to lose track where the graph is when zooming too far. For that reason I limited the ability to zoom excessive amounts. Max zoom-out:
Max zoom-in:
I noticed that examples found online are not perfect because the QGraphicsScene gets centered when certain zoom-out level is reached. I wanted to avoid that and tackled that problem by:
- making QGraphicsScene much larger and setting certain initial zoom-in level
- limiting possibility to zoom-out (this way the graph is never centered when zooming-out)
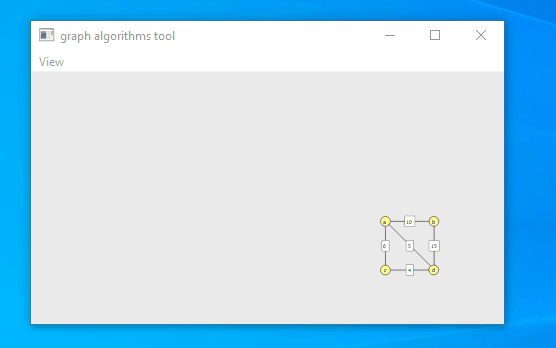
If someone carelessly resized the window, it would be possible to lose track where the graph is. For that reason I implemented feature that keeps the graph in sight when the main window is resized.
As described above, the user interface is adjustable. It would be frustrating to put effort into adjusting user interface, restarting program and losing the changes. For that reason I implemented saving and loading size and position of all windows/docks. It required some tweaks to work well with both:
- main window
- QDockWidget based sub-windows
That's how it is implemented for the main window:
// mainwindow.cpp file

// LOADING
MainWindow::MainWindow(QWidget *parent) {
    if (settings->value("saved_state_and_geometry", false).toBool()) {
        bool restored = restoreGeometry(settings->value("mainwindow/geometry").toByteArray());
        if (!restored)
            qDebug() << "Couldn't restore geometry for some reason...";

        setWindowState((Qt::WindowState)settings->value("mainwindow/windowStateFunc").toInt());
    }
}

// STORING
void MainWindow::closeEvent(QCloseEvent *event) {
    settings->setValue("mainwindow/geometry", saveGeometry());
    settings->setValue("mainwindow/windowState", saveState());
    settings->setValue("mainwindow/windowStateFunc", (int)windowState());
    settings->setValue("saved_state_and_geometry", true);
    QMainWindow::closeEvent(event);
}
That's how it is implemented for the QDockWidget based sub-windows:
// dock.cpp file

// LOADING
Dock::Dock(QGraphicsItem *item_, QString title, Qt::DockWidgetArea area_, QWidget *parent, Qt::WindowFlags flags) {
    const QString prefix = "dock_" + windowTitle() + "/";
    if (settings->value(prefix + "was_saved", false).toBool()) {
        bool is_floating = settings->value(prefix + "is_top_level").toBool();
        Qt::DockWidgetArea area_ = (Qt::DockWidgetArea)settings->value(prefix + "QtDockWidgetArea").toInt();
        // "no dock" is claimed to be invalid when used in "addDockWidget"
        if (area_ == Qt::NoDockWidgetArea)
            area_ = area;

        main_window->addDockWidget(area_, this);
        setFloating(is_floating);
        restoreGeometry( settings->value(prefix + "geometry").toByteArray() );
    } else {
        main_window->addDockWidget(area, this);
    }
}

// STORING
Dock::~Dock()
{
    QSettings settings("settings.ini", QSettings::IniFormat);
    const QString prefix = "dock_" + windowTitle() + "/";
    settings.setValue(prefix + "was_saved", true);
    settings.setValue(prefix + "geometry", saveGeometry());
    settings.setValue(prefix + "is_top_level", isWindow());
    settings.setValue(prefix + "QtDockWidgetArea", (int)area);
}
The custom built graph and currently selected algorithm are also saved and loaded when program starts.
QString algorithm_name = settings->value("last_selected_algorithm", "Prims").toString();
QComboBox *combobox = select_algorithm_widget->ui->comboBox_algorithm;
combobox->setCurrentText(algorithm_name);

if (settings->value("last_graph_saved", false).toBool()) {
    QJsonObject json_graph = QJsonObject::fromVariantMap( settings->value("last_graph").toMap() );
    Graph *last_graph = Graph::fromJson(json_graph);
    ui->graphicsView->setGraph(last_graph);
}
Here's a part of the code responsible for deleting the nodes and edges.
// abstract_scene.cpp file

void AbstractScene::keyPressEvent(QKeyEvent *event) {
    if (key == Qt::Key_Delete) {
        if (Node * selected_node = main_graph->selectedNode()) {
            main_graph->removeNode(selected_node);
        }

        if (Edge * selected_edge = main_graph->selectedEdge()) {
            if (selected_edge->getLabelItem()->hasFocus() == false)
                main_graph->removeEdge(selected_edge);
        }
    }
}
Node labels are assigned in alphabetical order. If some node is removed, then the next created node will reuse its' label. It was implemented using "node_label_map".
Node *Graph::addNode()
{
for (const NodeLabel &label : node_labels_map.keys())
if (!node_labels_map[label])
return addNode(label);
if (!node_labels_map.isEmpty())
return addNode({node_labels_map.lastKey().id + 1});
return addNode({"a",0});
}
Node * Graph::addNode(const NodeLabel &label)
{
node_labels_map[label] = true;
return getNodeForLabel(label.q_string);
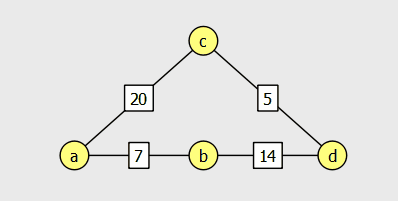
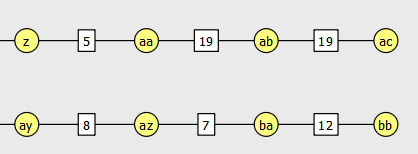
}Letters are appended after reaching "z" as shown on image below:
Labels can be converted to IDs increased and reverted using "IdToLabel" and "LabelToId" methods shown below, however such conversions are limited to minimum in the program to improve performance.
// based on this answer: https://stackoverflow.com/a/55655445/4620679
// from this question:   https://stackoverflow.com/questions/55655137/how-do-i-create-a-dynamic-alphabet-id-system
QString Graph::IdToLabel(int id_)
{
    static const char * alphabet = "abcdefghijklmnopqrstuvwxyz";
    static const int alphabet_sz = 26;
    if (id_ < alphabet_sz)
        return QString().sprintf("%c", alphabet[id_]);
    return IdToLabel(qFloor(id_ / alphabet_sz) - 1) + IdToLabel(id_ % alphabet_sz);
}


int Graph::LabelToId(QString label_)
{
    static const int alphabet_sz = 26;

    int sum = 0;
    int mult = label_.size();
    for (QChar c : label_) {
        int i = c.toLatin1() - 'a';
        int j = pow(alphabet_sz, --mult);
        sum += (i+1) * j - (mult?0:j); // conditional needed because 'a' is 0
    }
    return sum;
}
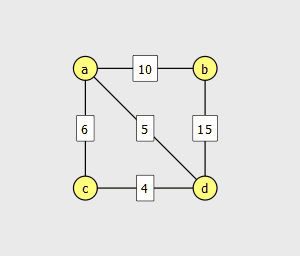
Edge weights are displayed neatly in the middle of edge graphics item. This is accomplished by EdgeTextItem class which is created for every edge and defines behaviour of the weight displaying rectangle. The code below shows the code responsible for filtering the entered text (using regular expression).
// edge_text_item.cpp

void EdgeTextItem::focusOutEvent(QFocusEvent *event)
{
    QString digits_only = this->toPlainText().remove(QRegExp("[^0-9]"));
    if (digits_only.isEmpty())
        digits_only = previous_value;
    setPlainText(digits_only);
    edge->adjust();
    scene()->update();
    emit textEntered(digits_only);

    QGraphicsTextItem::focusOutEvent(event);
}
User input is handled carefully ensuring that only digits can be supplied. It also prevents the text field from being empty (by restoring previously stored value if that is about to happen).

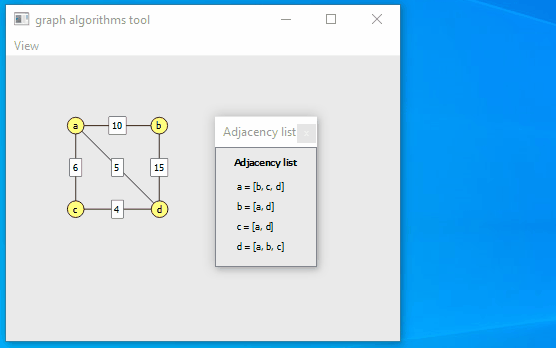
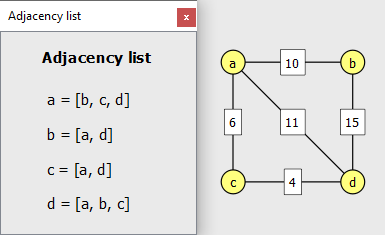
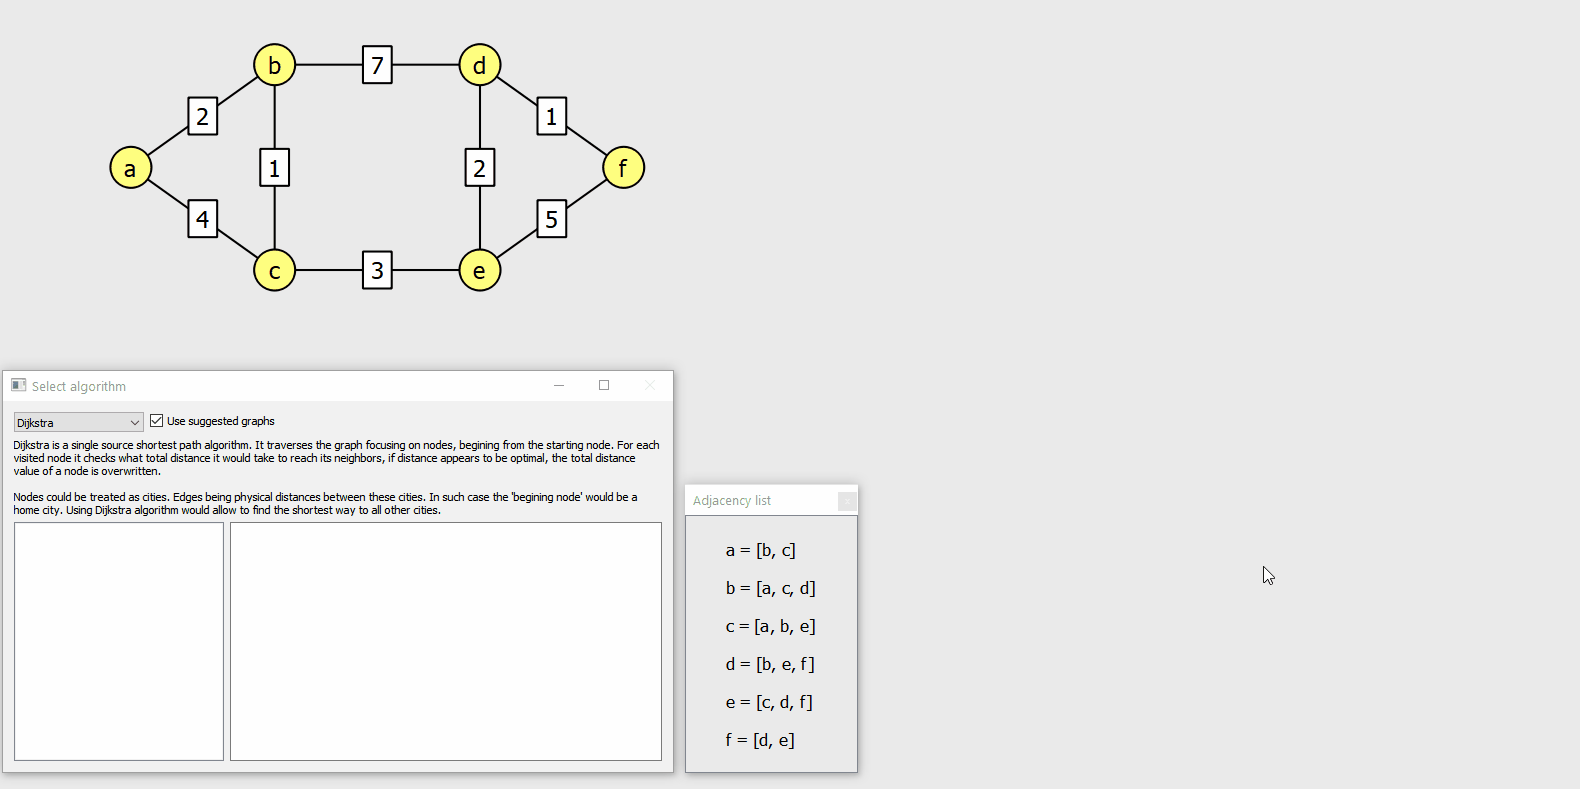
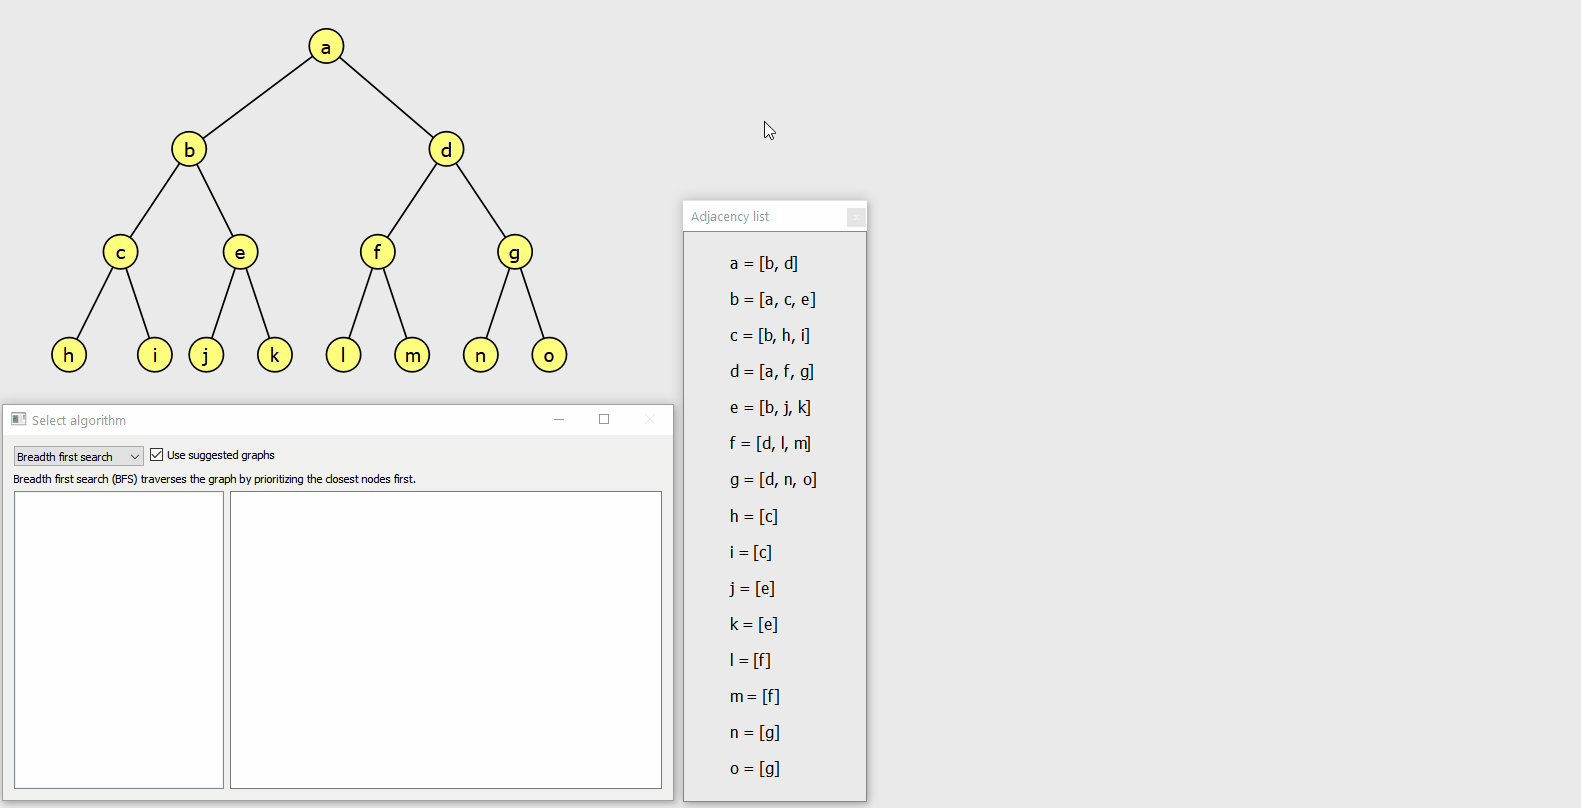
It allows viewing the graph using adjacency list representation regardless of which algorithm was selected. It gets updated whenever a node is added or removed from a graph.
I'm planning to implement equivalent adjacency matrix graphical item.
It is possible to save and load custom-built graph. Each graph has to be assigned an unique name. It is possible to delete previously saved graphs. These graphs are preserved after restarting the program.
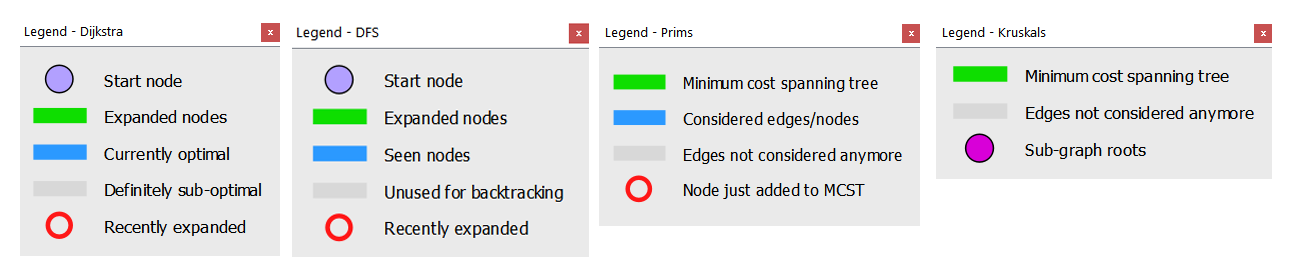
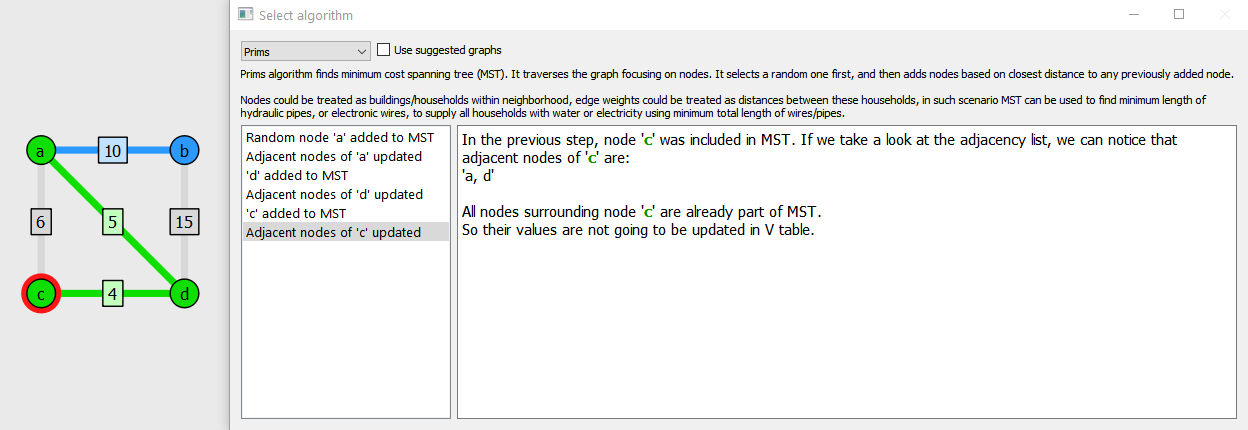
As the algorithms progresses, the graph is coloured to improve understanding, the "legend" graphical items describe what different colours and markers mean.
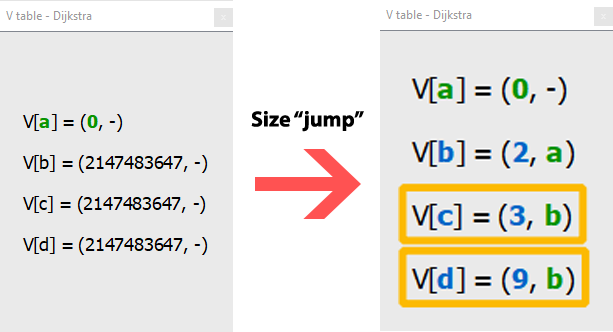
"V table" ("V" meaning vertices) is terminology from CE204 lecture slides, it is used to describe what some literature calls "dist" and "pred" arrays in various graph algorithms. These arrays are the key data structure and often the final result produced by these algorithms.
V table graphical item does not only show the current state of data. It also directs the attention of the user on what changes were made and what these changes could mean. For example it shows:
- colour coded node labels (e.g. allowing to easily distinguish which node is already a part of MST, which node is considered, and which node is not considered)
- orange rectangles around entries that were changed during the last iteration of the algorithm
- for Prim's algorithm it shows "<- min" label indicating entry with the lowest positive value within the table (which means that this edge will be added to MST)
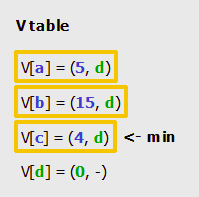
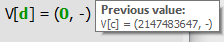
Using "tooltip" it also shows the previous value of entry when mouse cursor stays on top of an entry.
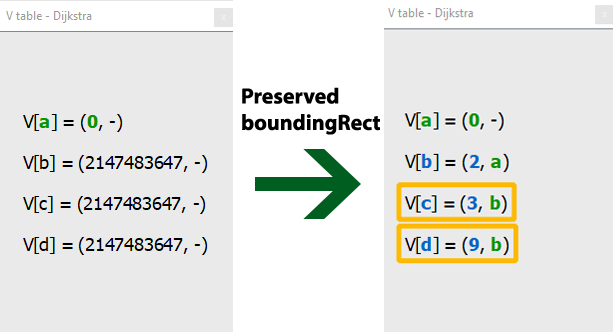
Docks are implemented in a way which adjusts contents of a dock to fill as much of a dock as possible. This created a problem for V table item because at the begining of many algorithms the initial weights are set to INT_MAX which is "2147483647" and that is a long number. Why was that a problem? Because as the algorithm progresses, these long values get decreased, reducing space taken by the V table, and resizing it to fit the dock, creating "size jumping" effect. People react to movement or size change so that effect can be considered as a bug, and that's why I tried to fix this problem. That's how the problem looked like:
I solved it by introducing "keepCurrentBoundingRect", "updateStaticBoundingRect" methods and implementing "boundingRect" with a conditional:
QRectF MovableGraphicsItem::boundingRect() const
{
    if (use_static_bounding_rect)
        return static_bounding_rect;
    return childrenBoundingRect().marginsAdded({10,10,10,10});
}
That's the result:
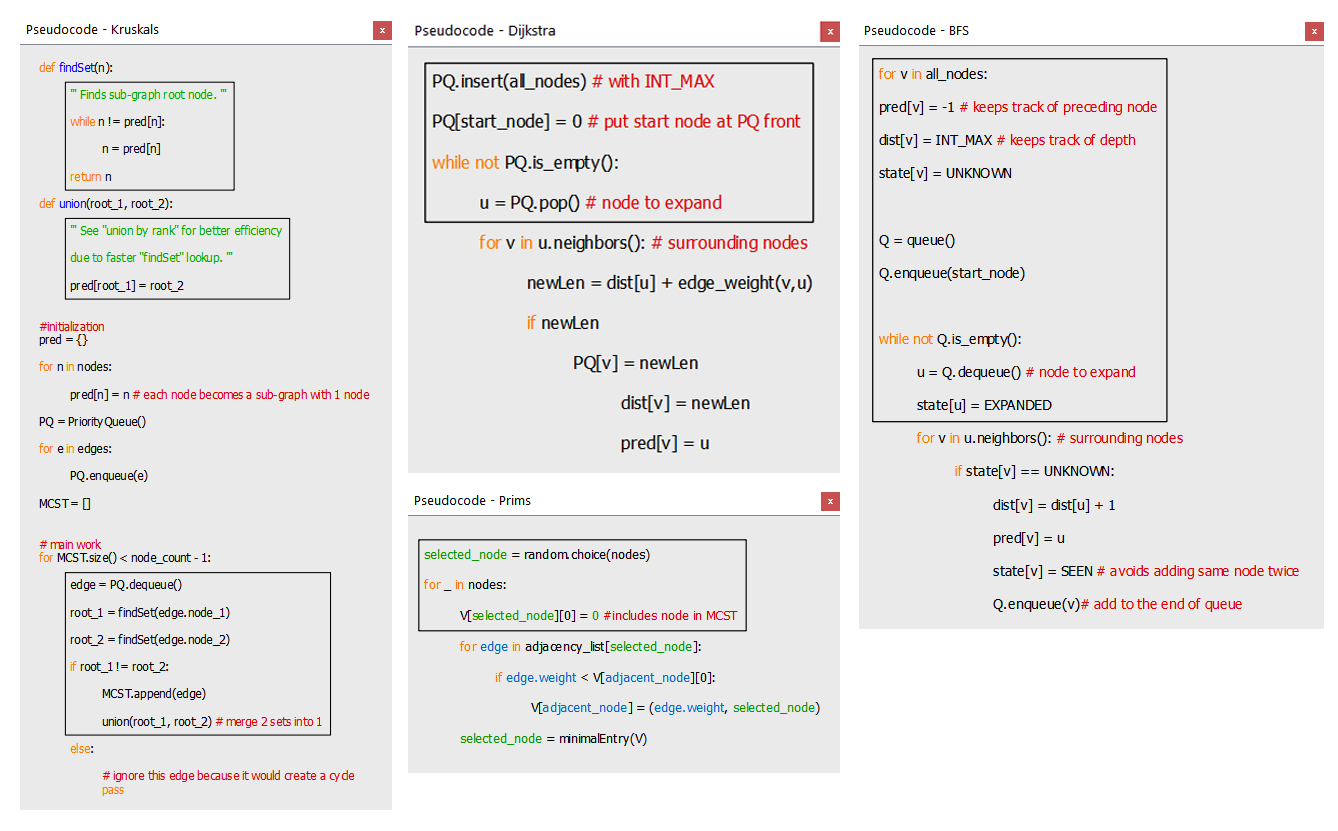
Computer science students are likely to be familiar with python syntax and possibly understand the working principle better by looking at python based pseudocode rather than by listening to verbal description. As the algorithm progresses, the set of instructions that resulted in current state is highlighted by drawing rectangle around relevant statements.
Typically, the concept of using queues, stacks or priority queues by algorithm is explained verbally. That by definition is subject to misinterpetation by students. Being able to visually see the "live" state of these key structures used by several algorithms will help students to understand how algorithms work and get intuition. Collection graphical items may store both, edges and nodes.
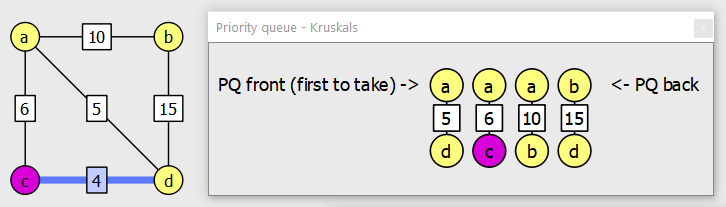
Priority queue (used for Kruskal's where it's initialized with all edges at the begining and gets dequeued until MST is completed)
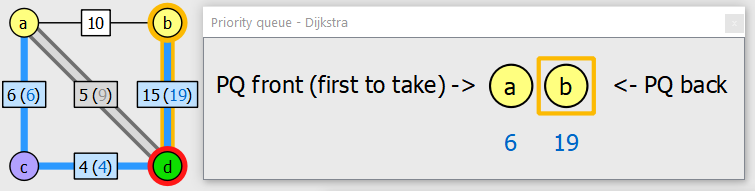
Priority queue (used for Dijkstra where it's purpose is to get the unvisited node with the shortest total path)
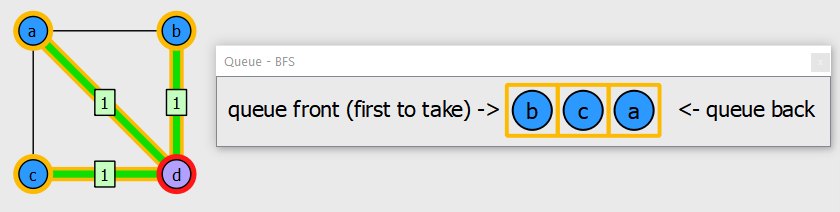
Queue (used for BFS)
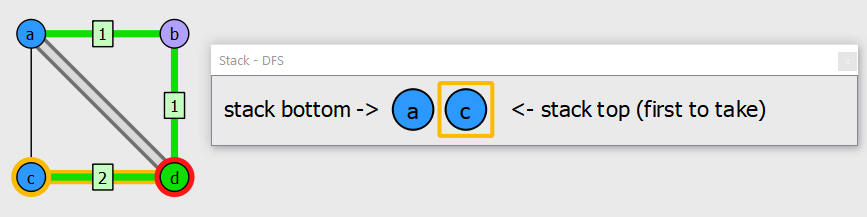
Stack (used for DFS)
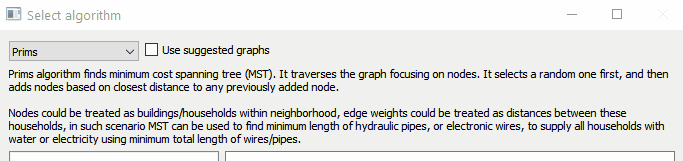
Combobox allows changing the current algorithm. Underneath there's a short description which can be:
Below, on the left side there's a list of selectable step labels (which gets populated as algorithm proceeds). On the right side there's a more in-depth description, explaining what changes occur and why they occur. It keeps track of previous steps and allows to select previous step by clicking on the label (on the left side). Consistent colouring was used to improve understanding, trying to make it more intuitive.
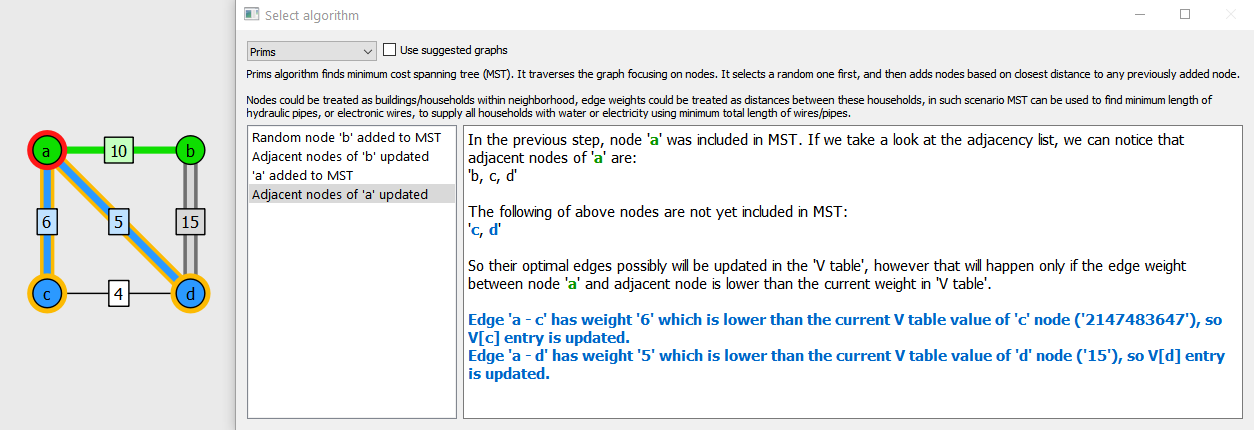
As mentioned on Jira, the descriptions are dynamic and conditional. By "dynamic" it is meant that descriptions should not only describe the principle in general, but also include labels of nodes/edges that were affected during a step. By "conditional" it is meant that descriptions should vary depending on circumnstances, for example:
- if all adjacent nodes (that supposed to be updated in V table) are already part of MST then appropriate message should be displayed as shown on image below
Right arrow button proceeds to the next step of algorithm. Colouring is used to signify nodes/edges of the graph. Where applicable changes are marked using orange colour (e.g. in collection items, or on the graph itself). For all algorithms except Kruskals, the user can select the starting node by clicking on it. It is also possible to reset the algorithm mid-run by pressing escape. Graph modification is partially disabled after making the first algorithm step, nodes can be moved, but they can't be added or removed, edge weights also cannot be changed (because such changes would disrupt algorithms integrity).
As the algorithm progresses, added edges form multiple sub-graphs that are marked using different colours. Additionally, the root node of each sub-graph is marked with violet colour which gets reverted to default when sub-graph is merged into another sub-graph (by newly added edge).
As the algorithm progresses, edges that are part of current optimal paths get assigned total distance (blue coloured value inside brackets) from starting node.
If the "Use suggested graphs" checkbox is checked then the graph is set to the one used by Dr. Abdul Bari in his Dijkstra algorithm video. Having only 6 nodes, it performs "relaxation" 3 times in total (not counting the initial nodes set to INT_MAX), which can be seen on animation below (previously blue edges turn gray because they're no longer optimal).
Similarily to DFS, the weights of edges become hidden when BFS is selected. As the algorithm progresses, the edge weights get assigned distance from the root node.
Similarily to BFS, the weights of edges become hidden when DFS is selected. As the algorithm progresses, the edge weights get assigned distance from the root node.